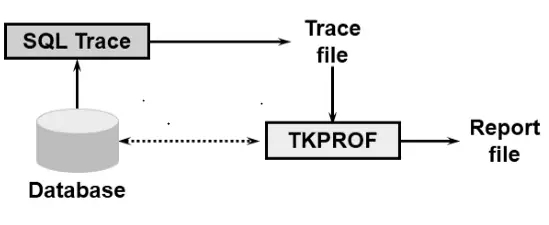
10046 traces and tkprof still save lives and we can use them for old and new versions. But sometimes it will be hard to collect the data if you are trying to help someone who has little oracle knowledge. They have to find the trace folder , identify the trace file and run tkprof…….It is even hard for me to follow…So I wrote this automator. Hope it will also make your day easier.
- Usage : @tkprof demo
- Input: A .sql file where the sqls reside. (demo.sql in this example)
- Output: A zipped file of the input sql, raw trace file and the tkprof output.
Just download the tkprof.zip file or create the three sql files as shown below and edit the demo.sql file. Below is a screenshot on the usage.

tkprof.sql
--Usage:        tkprof <sql_file_name>
--Example:      tkprof demo
--Purpose:      Getting a 10046 trace from a sql which resides in a file.
--Input:        A .sql file which includes sql statements ended with ;
--Output:       A zip file which includes the input .sql , raw trace and tkprof output.
--Notes:        Spools to /dev/null, change it if output is also important.

col TRACEFILE_NAME new_value tfn
col FID  new_value fid

var n number

set serveroutput on
alter session set STATISTICS_LEVEL = all;
alter session set MAX_DUMP_FILE_SIZE = unlimited;


--to get the dump folder location into tfn
@trace_location

--get the date_time as a uniq identifier
select to_char(sysdate,'YYYYMMDD_hh24mmss') as FID from dual;

--start the trace
alter session set events '10046 trace name context forever, level 12';

--get the start time
exec :n := dbms_utility.get_time
set term off
spool /dev/null
--spool out_&1
@&1
spool off
set term on
--stop the trace
alter session set events '10046 trace name context OFF';
--get the end time and the duration
exec dbms_output.put_line( ('The Query DURATION :' || (dbms_utility.get_time-:n)/100) || ' seconds...' );


--create the tkprof output
host tkprof &tfn  out_&1.&fid

--create the zip file
host zip -j zipped_&fid &tfn &1..sql out_&1.&fid..prf
host unzip -l zipped_&fid

--cleanse the folder .. uncomment the following line when you are sure everything works fine.
host rm -r out*
trace_location.sql
--Usage: trace_location
--Example: tkprof
--Purpose: Getting the trace location
--Input: None
--Output: Location of the trace file and spid of the session
--Notes: If you want to get the variable into a substitution variable check tkprof.sql
select
r.value ||'/diag/rdbms/'||
-- sys_context('USERENV','DB_NAME') ||'/'||
lower(sys_context('USERENV','DB_NAME')) ||'/'||
sys_context('USERENV','INSTANCE_NAME') ||'/trace/'||
sys_context('USERENV','DB_NAME') ||'<em>ora</em>'||p.spid||'.trc'
as tracefile_name, p.spid as spid
from v$session s,v$parameter r,v$process p
where r.name = 'diagnostic_dest'
and s.sid = (select sid from v$mystat where rownum=1)
and p.addr = s.paddr;
demo.sql
select a.* from dba_tables a,dba_tables
where rownum < 10000;
